

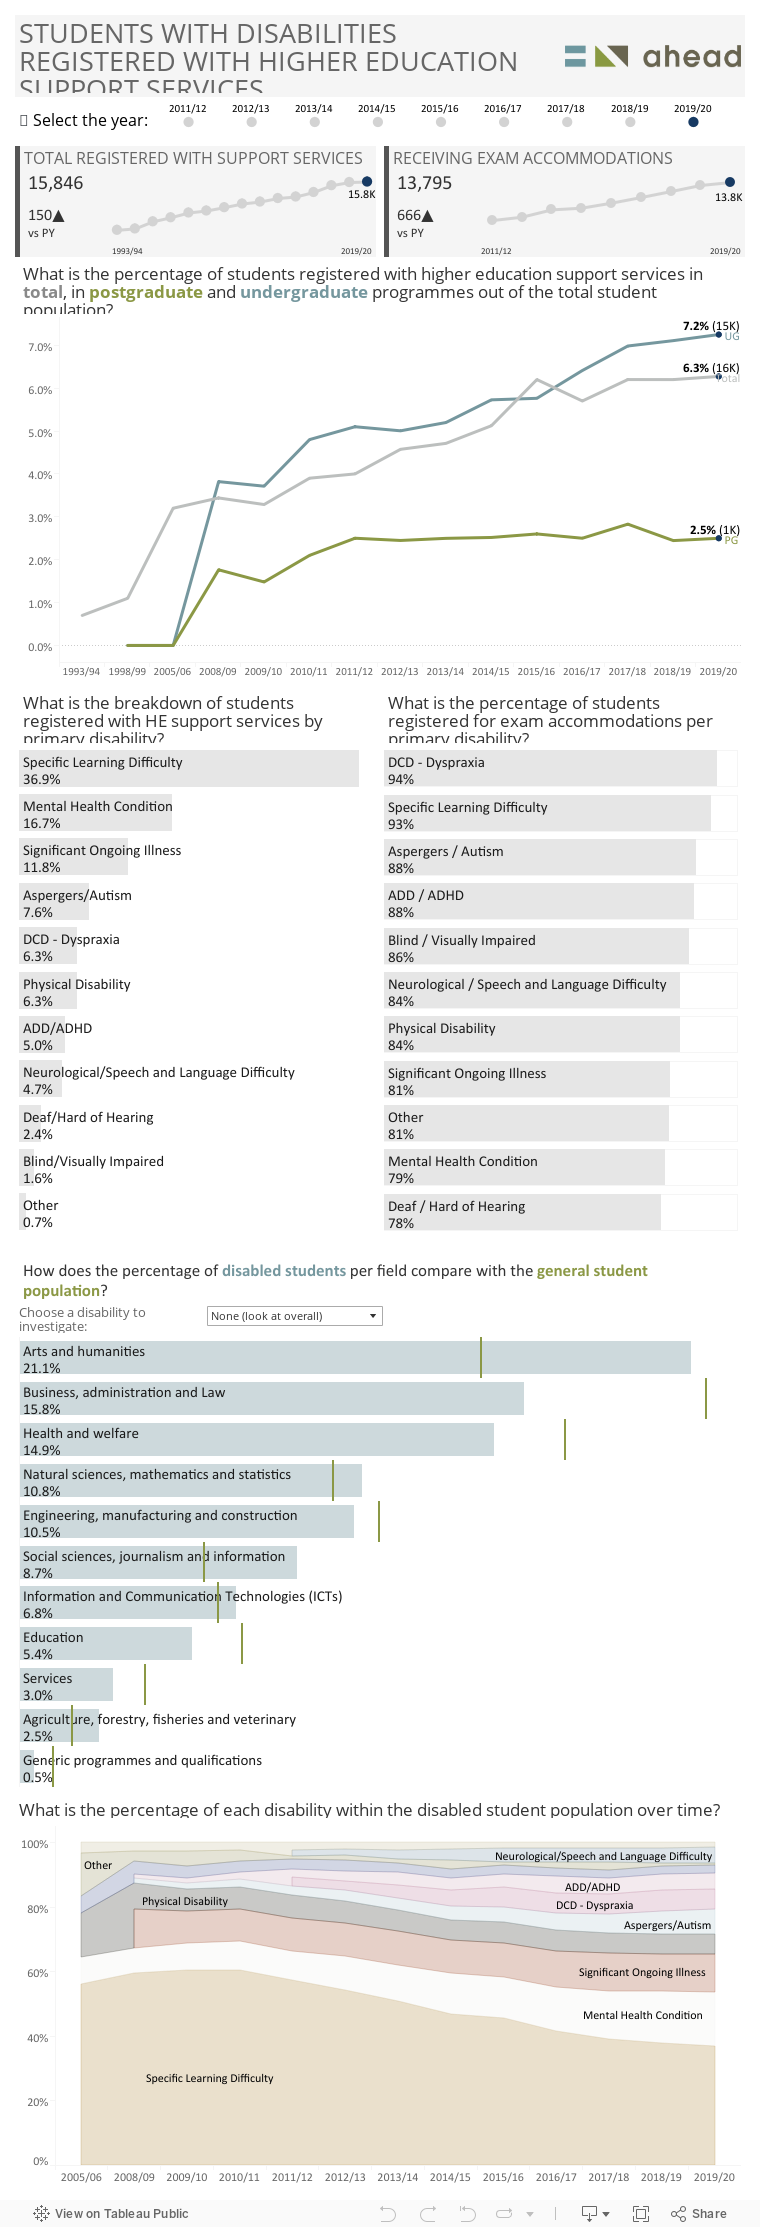
Interactive Data Centre Dashboard
Welcome to the Participation Rates Data Centre where you can interactively view historical data the on numbers of students with disabilities registered with disability support services in Higher Education in Ireland. The Interactive Data Centre Dashboard allows you to interact with graphs to show the information you require over time and explore our data set in different ways - you can filter out unwanted information, hover over the charts for added information and context, and click on bar charts to get further information and compare data as you wish. The various historical data reports which supply the underlying data set for this dashboard can be found in written report format in the data section of our publications page.
This dashboard is created for use on a laptop or desktop device and may not be properly viewable on a tablet or mobile device.
Last update: 2019/20 academic year data added Oct 2021
A Note on Accessibility
Please note that this dashboard is created in Tableau Public and may prove difficult to interact with using certain types of assistive technologies. If you find it more efficient to interact with the historical data reports which underpin this dashboard, they can be found in written report format (with accessibility features applied) in the data section of our publications page. If you have any queries around accessibility, please contact us and we will endeavour to assist you.
Video: How to Effectively Use Our Data Dashboard
This 14 min video highlights all the various ways in which you can interrogate our data set using the interactive dashboard.
Tips for use:
- Watch the video above to briefly learn how to use this dashboard effectively.
- Click below to view the year you wish to have primary data highlighted from. For historical data, the data points relevant to the year will be highlighted on the timeline, for the data breakdowns from a single year, only the selected year will be shown.
- Hover over data points to get more accurate tooltips and in-depth numbers relating to the data point.
- Some bar charts are clickable for additional information/highlighting, or just making the overlaying information say still for a while so you can read it.
- You'll occasionally see a dropdown menu where you can select an item for comparison e.g. selecting to compare the fields of study of of a specific category of disability with the general population.
.jpg)


